
What % of wedding guests RSVP yes? About 72 per 100
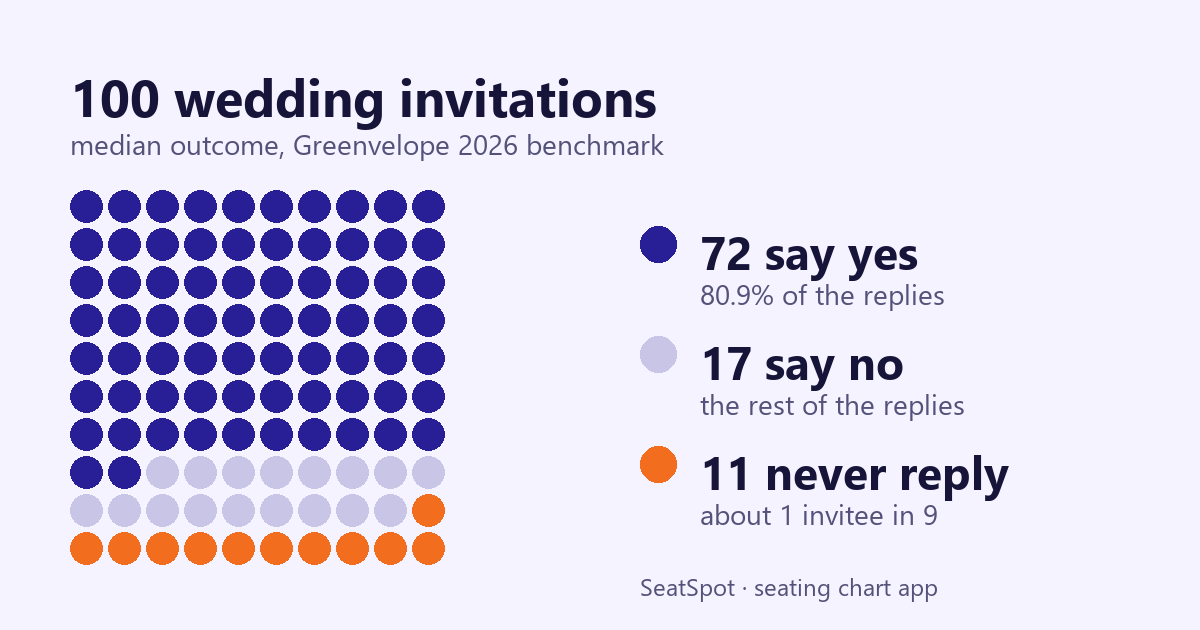
Plan on roughly 72 yeses for every 100 wedding invitations, plus about 11 people who never answer at all. That comes from Greenvelope's 2026 benchmark of more than 70,000 events sent through its digital invitations, where the typical wedding heard back from 88.9% of invitees and 80.9% of those replies were a yes.
The rest of this post turns those two percentages into numbers you can use: a lookup table for guest lists of 50 to 250, a range that accounts for the people who stay silent, and a reverse table that tells you how many to invite for the room you have.
Where do the numbers come from?
In July 2026 Greenvelope, a company that sells digital invitations, published response figures from 70,624 events sent between July 2025 and mid-June 2026. The report covers 23 event types and about 5.5 million invitations. For weddings it gives two medians:
| Measure | Wedding median | What it means |
|---|---|---|
| Response rate | 88.9% | Share of invitees who replied yes or no |
| Yes share | 80.9% | Share of replies that were a yes |
Multiply the two and you get the figure most couples actually want: about 0.72, or 72 yeses per 100 invited. The report runs the same calculation for 150 guests and lands on roughly 133 replies and 108 yeses.
Three limits are worth knowing before you lean on these numbers, and the report states them itself:
- One platform. Every event came through Greenvelope, whose invitations are addressed to each guest and can send targeted reminders. The company expects its rates to sit above what a mass email gets.
- Replies, not attendance. A yes on the RSVP is not the same as a person walking in on the day. Nobody measured who showed up.
- A median, not a promise. Half of weddings did better and half did worse. Travel distance, a holiday weekend or a destination venue can move your numbers a long way.
Treat 72% as a starting estimate, then replace it with your own numbers as replies come in.
How many replies, yeses and silent guests should I expect?
Here is the benchmark applied to common guest list sizes. All figures are people, rounded to whole guests, and the table is our own arithmetic from the two medians above.
| Invited (people) | Replies (people) | Yes (people) | No (people) | Never reply (people) |
|---|---|---|---|---|
| 50 | 44 | 36 | 8 | 6 |
| 100 | 89 | 72 | 17 | 11 |
| 150 | 133 | 108 | 25 | 17 |
| 200 | 178 | 144 | 34 | 22 |
| 250 | 222 | 180 | 42 | 28 |
The column that causes the most trouble is the last one. By the benchmark, around one invitee in nine never replies. They are not a no, and they are not a yes either. Some of them will turn up.
Should I plan a seat for guests who never reply?
Yes, until you have chased them and they have said no. The safe planning range runs from the yeses alone up to the yeses plus every silent guest:
| Invited (people) | Likely yes (people) | If every silent guest comes (people) | Gap to cover (seats) |
|---|---|---|---|
| 50 | 36 | 42 | 6 |
| 100 | 72 | 83 | 11 |
| 150 | 108 | 125 | 17 |
| 200 | 144 | 166 | 22 |
| 250 | 180 | 208 | 28 |
At 150 invitations that gap is 17 seats, a little more than two full 8-seat round tables. It is the difference between a room that works and one where the last tables are squeezed against the dance floor.
The gap shrinks as you follow up. A wedding planning guide from Joy suggests an RSVP deadline three to four weeks before the wedding and a phone call or text to anyone who has not answered, rather than another email. Every silent guest you reach moves from the gap into the yes or no column. Joy also recommends keeping two to four spare seats spread across flexible tables for the last-minute changes that follow anyway.
How many people should I invite for my venue?
Run the same benchmark backwards. Divide the number of seats by the share you expect to fill them:
- Median plan: seats divided by 0.72. You fill the room if your guests behave like the median.
- Safe plan: seats divided by 0.83 (yeses plus silent guests). The room still fits even if every non-replier turns up.
| Seats in the room (people) | Safe plan: invite up to (people) | Median plan: invite about (people) |
|---|---|---|
| 100 | 120 | 139 |
| 120 | 144 | 167 |
| 150 | 180 | 209 |
| 200 | 240 | 278 |
The table uses the unrounded medians (88.9% × 80.9% = 71.9%), so a column can differ by one person from a hand calculation with 0.72. If the list is longer than either column allows, our guide on how to cut your wedding guest list shows how to sort names into A, B and C lists; it uses the common 15 percent decline rule, which gives 117 invitations for 100 seats where the benchmark gives 120.
The safe plan is the one to use when the venue has a hard fire-code limit or the caterer charges for a fixed minimum you cannot exceed. The median plan suits couples who would rather have a full room and can add a table if more people say yes than expected. Anywhere between the two columns is a judgment call, and the right answer depends on how many of your guests have to travel.
If your list leans toward local family and close friends, expect to land above the median. If many guests would need flights or hotel rooms, plan nearer the safe column or below it.
How do I replace the benchmark with my own numbers?
Once the first wave of replies arrives, your own rate is better than any benchmark. A simple way to update the estimate:
- Count the replies you have and the yeses among them. Your yes share is yeses divided by replies.
- Multiply the guests still waiting by your yes share. That is your best guess for how many of them will come.
- Add that to the yeses you already have. Plan seats for the yeses plus everyone still waiting, and meals for the yeses only.
A worked example: you invited 150. After two weeks, 90 have replied and 68 said yes, a yes share of about 76%. Sixty are still waiting, and 76% of 60 is about 45. Your best estimate is 68 + 45 = 113 guests, and you keep seats for 128 (68 plus all 60 waiting) until the follow-up calls are done.
Doing this in SeatSpot
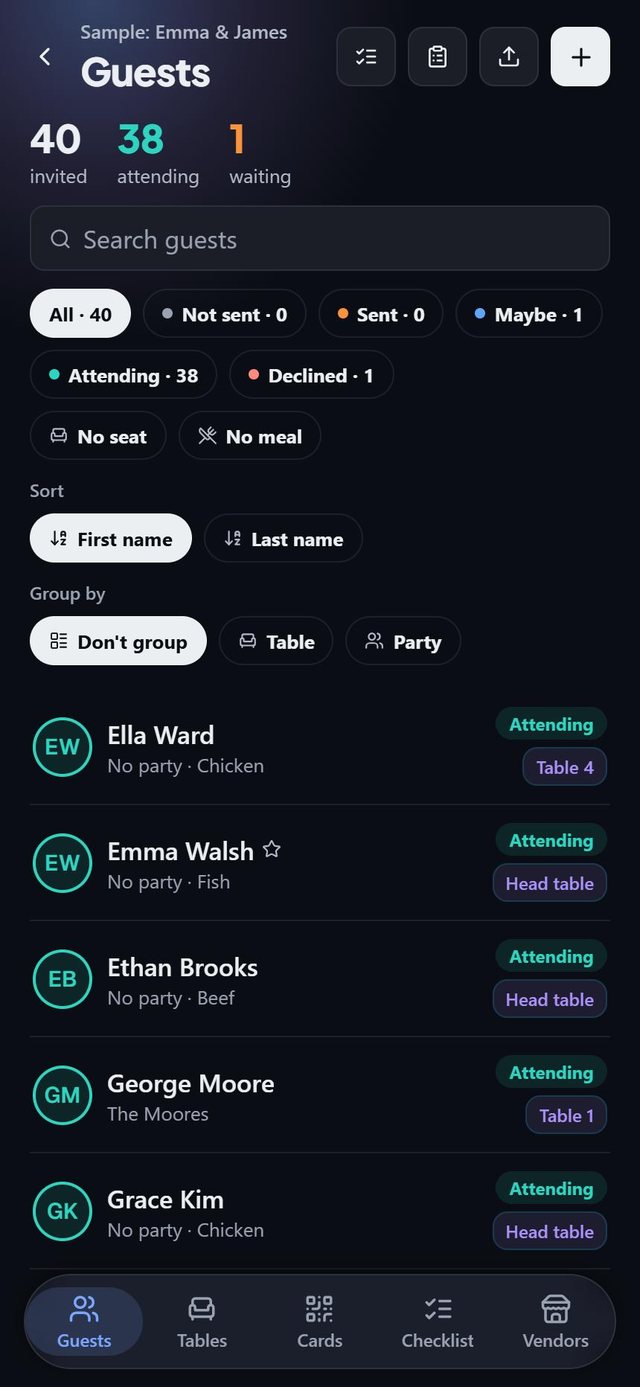
SeatSpot is a seating chart app, available on Google Play and the App Store.
- Keep the three numbers in view. The guest list opens with invited, attending and waiting, where waiting is everyone you have not heard a yes or a no from. Waiting is the silent-guest column of the tables above. See RSVP tracking.
- Hold seats for silent guests. The table planner counts everyone except people who declined, so a seat stays planned until the guest says no, and marking someone as declined frees their seat straight away.
- Use Maybe for half answers. If a guest replies "we would love to, but we have to sort out childcare", set the status to Maybe. It holds a seat for them and keeps them out of the meal counts you give the caterer, which only ever come from guests who are attending.
- Read the guest report. It opens with a ring showing where every invitation stands (attending, maybe, sent, not sent, declined) and how many seats are filled out of the room's total. See the guest report.
- Let reminders chase the gaps. For a dated event the app sends planning reminders 30 and 14 days before, which say how many RSVPs are still missing or how many guests still need a seat. See reminders.
- Start before you have names. If you know the size of the event before the names, Add a headcount puts numbered placeholder seats on the plan, so you can lay out tables now and type names in as replies arrive. See headcount.
Questions people ask
What percentage of wedding guests RSVP yes?
In the Greenvelope 2026 benchmark, 80.9% of wedding replies were a yes, and 88.9% of invitees replied. Together that is about 72 yeses per 100 invitations. It describes replies on one platform, not confirmed attendance.
Is the old rule of thumb that 20% will decline still right?
It is close for replies: in the benchmark, about 19% of wedding replies were a no. The rule hides the people who never answer, though, and they are the ones who decide whether you need an extra table.
Do guests who never RSVP count toward the caterer's numbers?
Usually not, until they confirm. Give the caterer counts from confirmed guests only, and keep seats for silent guests until the follow-up is done. Joy suggests locking the seating chart about two weeks out and sending it to the caterer and venue coordinator then.
Do bigger weddings get a better reply rate?
Across all 23 event types in the benchmark, events with 101 to 250 invitees had the highest median reply rate, 92.5%. The report does not break that down for weddings alone.
Created by Mariusz Bednarczyk, fact-checked against the sources above and approved by him before publication. How we make posts: About the blog.
Plan it next
Related guides
- Wedding B list: when to send second-round invites
- How to follow up on wedding RSVPs
- When does the caterer need a final headcount?
Start here: How to make a wedding seating chart, step by step
More in Guest list and RSVPs